
Ever felt like your PowerPoint slides could use a sprinkle of clarity? If you frequently use PowerPoint to present, I’m pretty sure you’ve (at least) once grappled with the thought of visually intertwining ideas without causing a tangle. What if there’s a simple yet impactful way to highlight similarities, contrasts, and overlaps in your content?
One way or another, you’ve probably yearned for that transformative visual element to elevate your ideas. Simplifying complex concepts or illustrating overlapping thoughts without losing your audience’s focus can be a challenge.
Today, we’re delving into the ultimate hack in making a Venn diagram in PowerPoint. Stay with me, and let’s unlock a fresh approach to captivate your audience.
Table of Contents
Why Use a Venn Diagram in a PowerPoint Presentation?
What is a Venn diagram?
A Venn diagram is a visual representation that illustrates the relationships between different sets or categories. It consists of overlapping circles or shapes, where each circle represents a set, and the overlapping areas signify commonalities between these sets. Creating a Venn diagram in PowerPoint is a useful tool to better visualize topics with overlapping concepts.

1. Enhance Clarity and Understanding
Venn diagrams simplify complex ideas by breaking them down into distinct categories, making content more accessible and facilitating a deeper understanding of intricate concepts.
2. Facilitate Comparison and Contrast
By visually representing overlaps and distinctions between sets, a Venn diagram in PowerPoint efficiently streamlines information, enabling viewers to quickly identify similarities and differences, enhancing comprehension and analysis.
3. Engage Your Audience Visually
Utilizing a Venn diagram in PowerPoint as a visual anchor captures attention and enhances retention. These visual representations serve as focal points, guiding the audience’s focus and reinforcing key themes or messages.
4. Provide Context and Relevance
Venn diagrams create meaningful connections between various elements, illustrating how they relate to a central theme or concept. By tailoring content to align with audience interests, these diagrams add depth and relevance to presentations.
5. Promote Interactive Discussions
Employing a Venn diagram in PowerPoint as a discussion starter encourages audience participation and fosters collaboration. These visual tools facilitate group activities, brainstorming sessions, and idea generation, enhancing engagement and interaction during presentations.
3 Simple Ways to Create a Venn Diagram in PowerPoint
Method #1: Using PowerPoint shapes (with a bonus special interactive feature!)
Believe it or not, crafting a Venn diagram in PowerPoint is simpler than you think! You can make use of native PowerPoint shapes, and with a clever twist using the ‘Merge Shapes’ function, you’ll be amazed at the customization you can achieve:
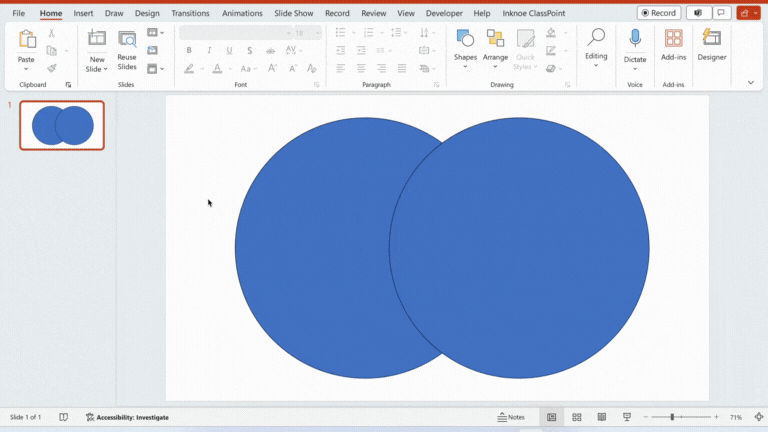
- Insert shapes (circles or ovals) from the “Insert” tab.
- Position and overlap shapes to create intersections.
- Select the shapes and from the “Shape Format” tab, click on the “Merge Shapes” dropdown and select “Fragment”.
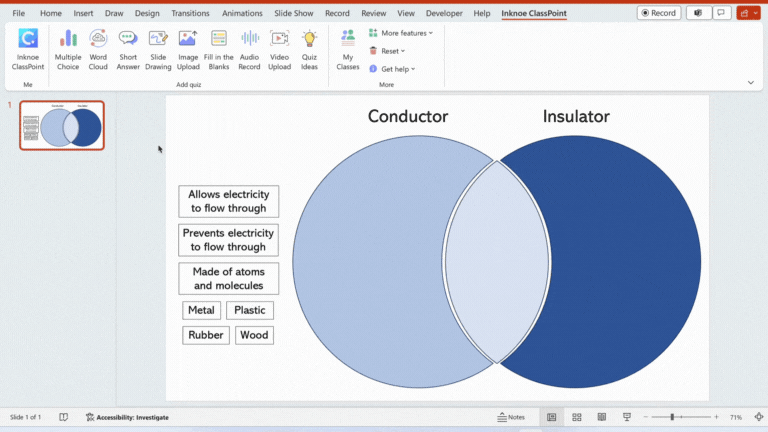
The 'Fragment' feature in PowerPoint's 'Merge Shapes' allows you to break overlapping shapes into distinct segments. This breaks apart overlapping parts of shapes so you can customize them, just as how you would in a Venn diagram.
- Set different colors, patterns, or fills for each of the segment within your diagram.
- Add text or labels inside shapes to represent elements or categories.
Now, to make it fun and engaging.. 😉
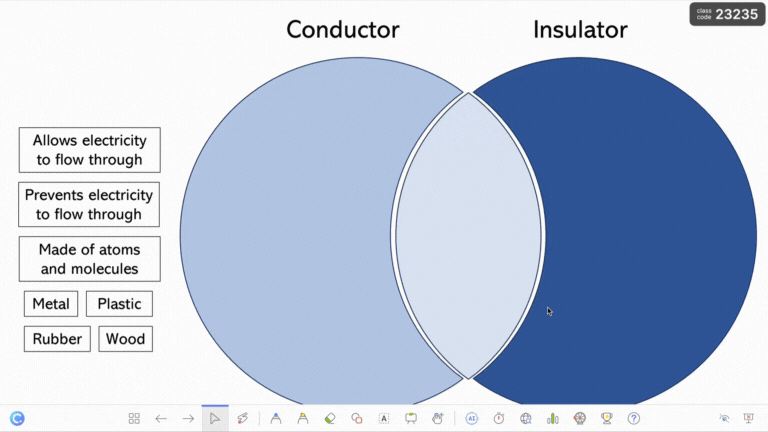
Make your presentation interactive and engaging by transforming your Venn diagram into a sorting activity. Set a theme, divide segments into categories, and provide text or elements for your audience to drag and drop into corresponding areas. How to create a drag & drop activity in PowerPoint, you ask? You can easily do it with Draggable Objects!
Draggable Objects is a feature from the #1 audience engagement tool in PowerPoint, ClassPoint. This feature allows you to drag & drop elements live during slide show without the need for macros, VBA coding or animations!
- Select all the text or elements you wish to turn into Draggable Objects
- Go to the Inknoe ClassPoint tab from your PowerPoint ribbon
- Click on the More Features dropdown, and select Draggable Objects
- Toggle on Enable Drag and you’re good to go!
- Enter slide show and enter Draggable Objects mode and start drag & dropping live in slide show.
Need ideas on more drag & drop activities you can host in PowerPoint? Learn more here.
Method #2: Using SmartArt Graphics
If you’re looking for a structured approach, SmartArt Graphics come to the rescue! With predefined Venn diagram layouts, you can quickly visualize relationships and effortlessly customize the design to suit your presentation:
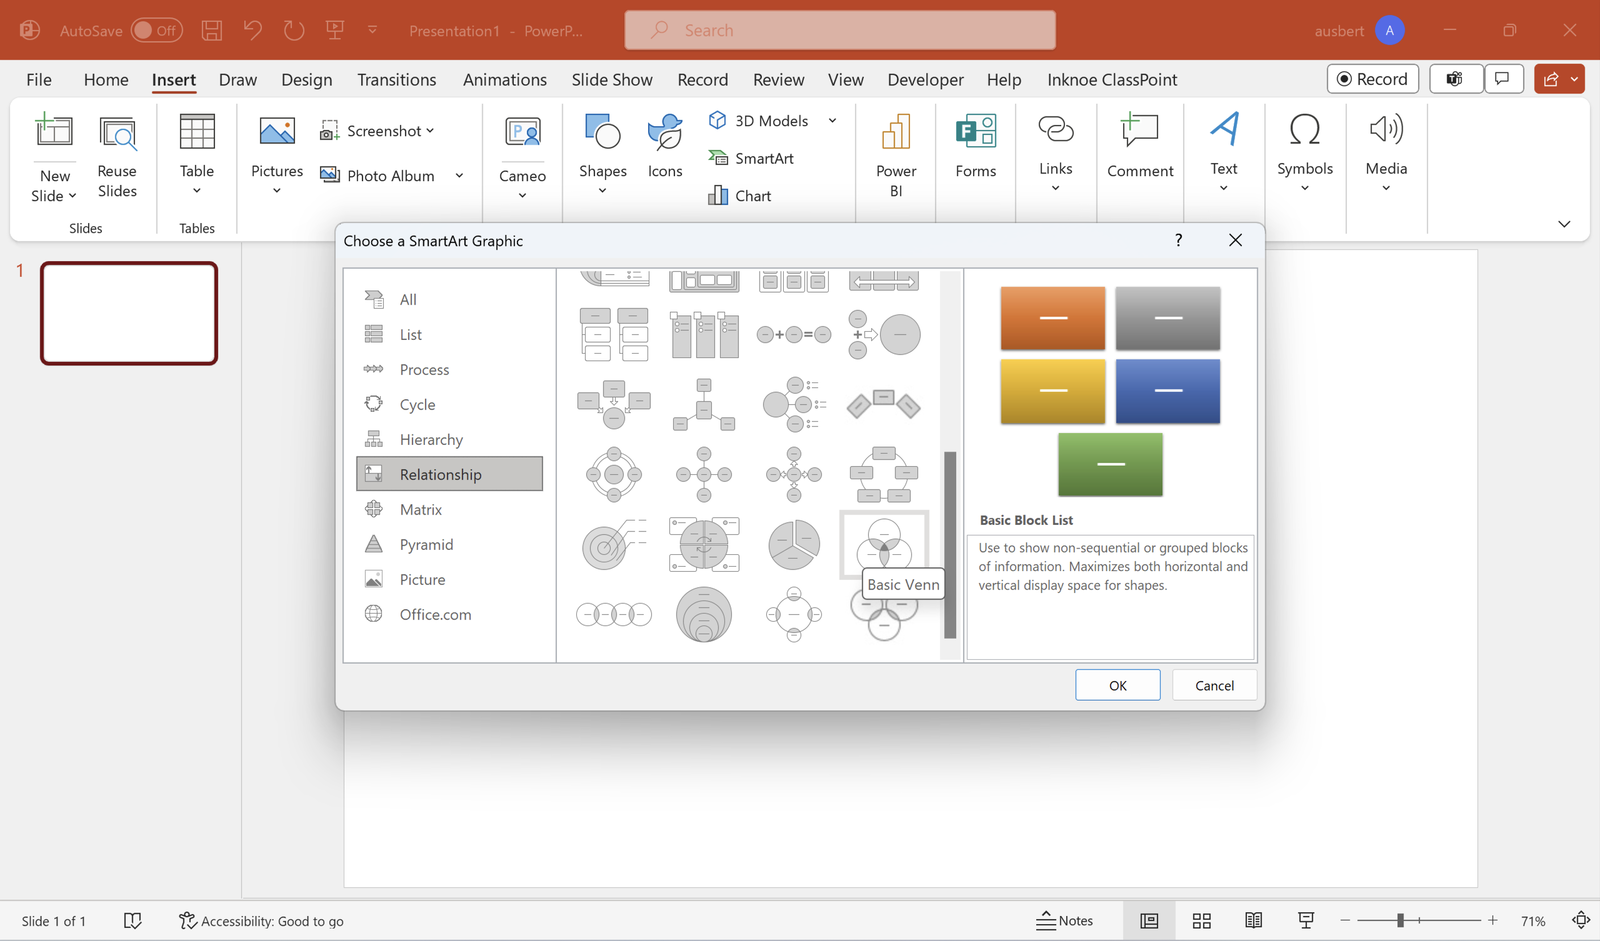
- Navigate to the “Insert” tab and select “SmartArt.”
- Choose a Venn diagram layout from the “Relationship” category.
- Enter text or data directly into SmartArt placeholders.
- Customize SmartArt layout, colors, styles, and design elements.
- Review and adjust the SmartArt Venn diagram for accuracy and clarity.
Method #3: Using a Ready-Made Venn Diagram Template
Did you know you can access ready-made Venn diagram templates from various resource websites? One such go-to platform is well-known for its versatile design options, Canva.
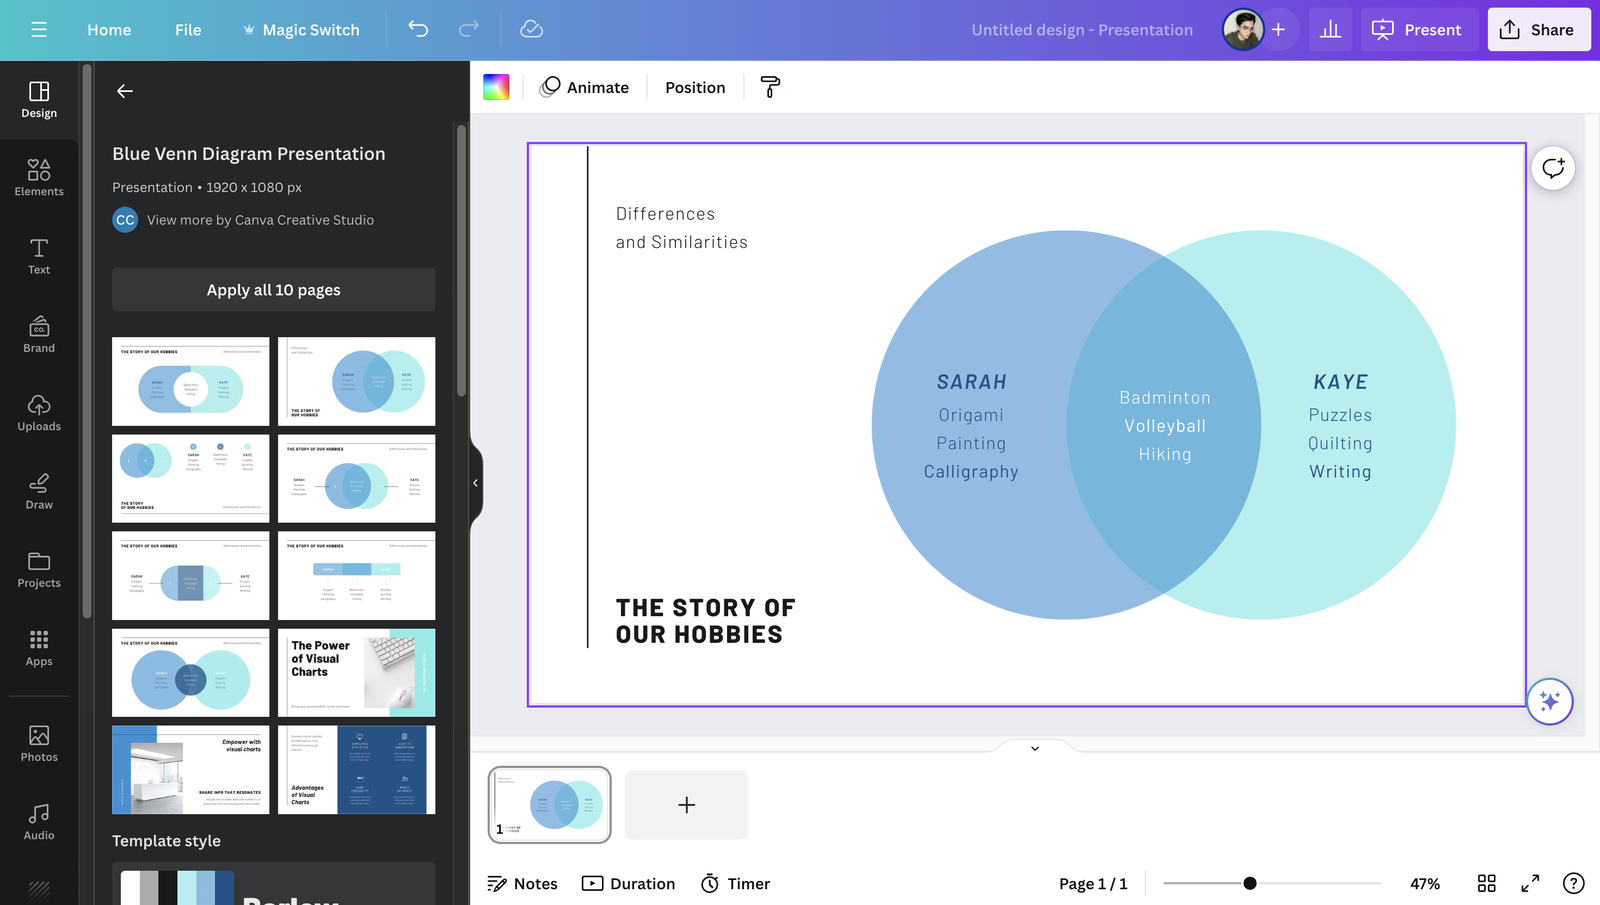
- Create a Canva design within the presentation size selection.
- Explore the selection of Venn diagram templates available on the Canva library.
- Choose a template that aligns with your presentation’s theme or design preferences.
- Save and download your customized Venn diagram as a .PPTX file.
- Launch Microsoft PowerPoint and open the downloaded .PPTX file.
- Modify and align the Venn diagram elements within PowerPoint to suit your presentation’s requirements.
- Add text, labels, or annotations as necessary for clarity and relevance.
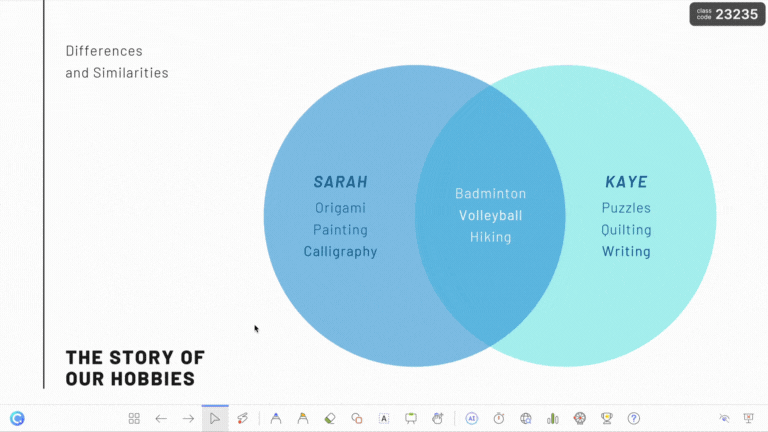
Ever tried doing annotations live during slide show? With ClassPoint, you can. Use pens, highlighters, shapes, and even text boxes as you present with ClassPoint's live annotation toolkit. Perfect for Venn diagram templates so you can present them like a pro.
Best Practices for Designing Effective Venn Diagrams
Here are some key best practices to guide you in designing compelling Venn diagrams for your presentations and educational materials:
🎯 Define Clear Categories: Ensure each circle in your Venn diagram represents distinct categories or sets, avoiding ambiguity and fostering clarity in your visual representation.
🔍 Highlight Intersections: Emphasize overlapping areas to illustrate shared characteristics or relationships between categories, guiding viewers’ attention to key intersections within the diagram.
🌈 Utilize Consistent Colors: Choose a consistent color scheme for each category and intersection, enhancing visual coherence and facilitating comprehension across your Venn diagram.
📝 Incorporate Descriptive Labels: Add descriptive labels or annotations to each segment and intersection, providing context and guiding viewers’ interpretation of the relationships depicted.
📊 Maintain Proportional Sizing: Ensure proportional sizing of circles and overlapping areas within your Venn diagram, accurately reflecting the relative significance or frequency of elements across categories.
🔗 Establish Logical Flow: Organize your Venn diagram with a logical flow, arranging categories and intersections in a structured manner that aligns with your presentation’s content and objectives.
👁️ Prioritize Readability: Optimize text size, font style, and layout to enhance readability, ensuring viewers can easily interpret and understand the information presented in your Venn diagram.
🔄 Iterate and Refine: Regularly review and refine your Venn diagram based on feedback, insights, or changes in your presentation’s context, ensuring it remains relevant, accurate, and impactful for your audience.
Food for Thought
Wrapping up our deep dive into 3 simple ways to create a venn diagram in PowerPoint, it’s evident that this versatile tool holds more power than we often realize. From simplifying complex ideas to fostering engagement, the ability to craft a compelling Venn diagram can be a game-changer in your presentations.
As you venture forth into your next PowerPoint presentation, remember the core essence: simplicity meets effectiveness. Utilizing these techniques allows you to transform overlapping circles into a cohesive visual story. What will your next Venn diagram be about?
