
Classrooms can feel like a second home one minute and a mini-battlefield the next. Figuring out how to measure student engagement in that ever-shifting space is half the job, and usually the messier half.
Student engagement boosters, live polls, and gamified learning platforms make it easier to see who’s with you. But unless you’re jotting down what actually works (and what doesn’t), all those bells and whistles blur together by Friday.
This guide keeps things practical. We’ll walk through presentation-ready tactics that capture engagement signals in real time, so every move you make stays intentional and results-driven.
Let’s jump right into the first strategy.
Use Live Response Tools for Instant Feedback
Figuring out how to measure student engagement while you’re still teaching beats guessing after class. A quick, on-screen pulse check tells you whether to explain again, speed up, or switch tactics even before attention drifts.
Check out our curated list of 13 Best Audience Response Systems for Classrooms.
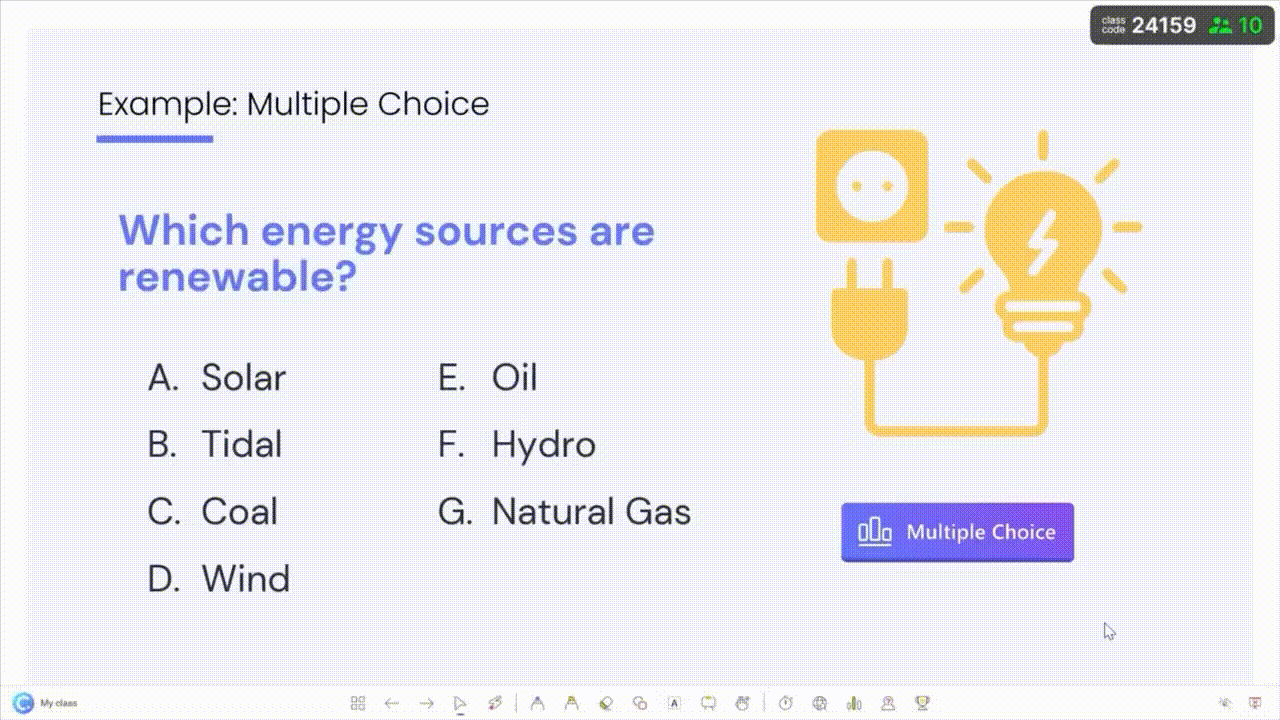
ClassPoint bakes that pulse check into the very content you already show. In PowerPoint, write your question prompts on your slides as usual, embed an interactive question button, and let every student answer from their own devices. The live, on-the-spot responses give you real evidence of who’s with you and who’s not, while you stay in the familiar interface of PowerPoint.
Quick tip: Kick off with low-stakes questions. The shift between those two snapshots gives you a built-in metric for engagement—no extra paperwork required.
Make a slide interactive in three clicks
- Draft the question on the slide. Type the question prompt (and choices if it’s Multiple Choice) right in your PowerPoint slides.
- Add a ClassPoint question button from your PowerPoint ribbon. Choose from 8 interactive question types, and set up question settings such as correct answers, timer, and more.
- Present → Collect Responses. In slide show mode, a unique class code (plus QR) appears. Invite students to open classpoint.app on their devices, and enter the code to join your class. Simply click on the question button you’ve added so students can start submitting responses straight to your PowerPoint presentation.
If you're just getting started, here's a quick guide on How to Make an Interactive Quiz in PowerPoint in Less Than 1 Minute!
Systematize Behavioral Clues
Don’t rely on a single “Are we good?” moment. Instead, collect bite-sized observations at set intervals and turn them into a running engagement log.
Classroom energy rises and dips every few minutes. By “sampling” visible behaviors on a schedule, (say, every third slide) you build a mini-dataset that shows when attention fades, not just whether it’s there. Pair each sample with a lightning-fast ClassPoint Quick Poll and you’ve got both sides of the story: what you saw and what students felt.
Keep a tiny grid on a clipboard (or sticky note on your desk). Every few minutes, scan the room and tick what you see. After two or three passes you’ll have a heat-map of attention that no test can give you.
| What to Watch | Signs They’re With You | Signs They’re Elsewhere |
|---|---|---|
| Eyes | Tracking slides, glancing at notes | Fixed on desk, wandering to phones |
| Hands | Writing, raising questions | Fidgeting, unrelated doodles |
| Posture | Leaning forward | Slumping, turning away |
| Whispers | Quick clarifications | Off-topic chat, giggles |
Then, back it up with a 30-second Quick Poll!
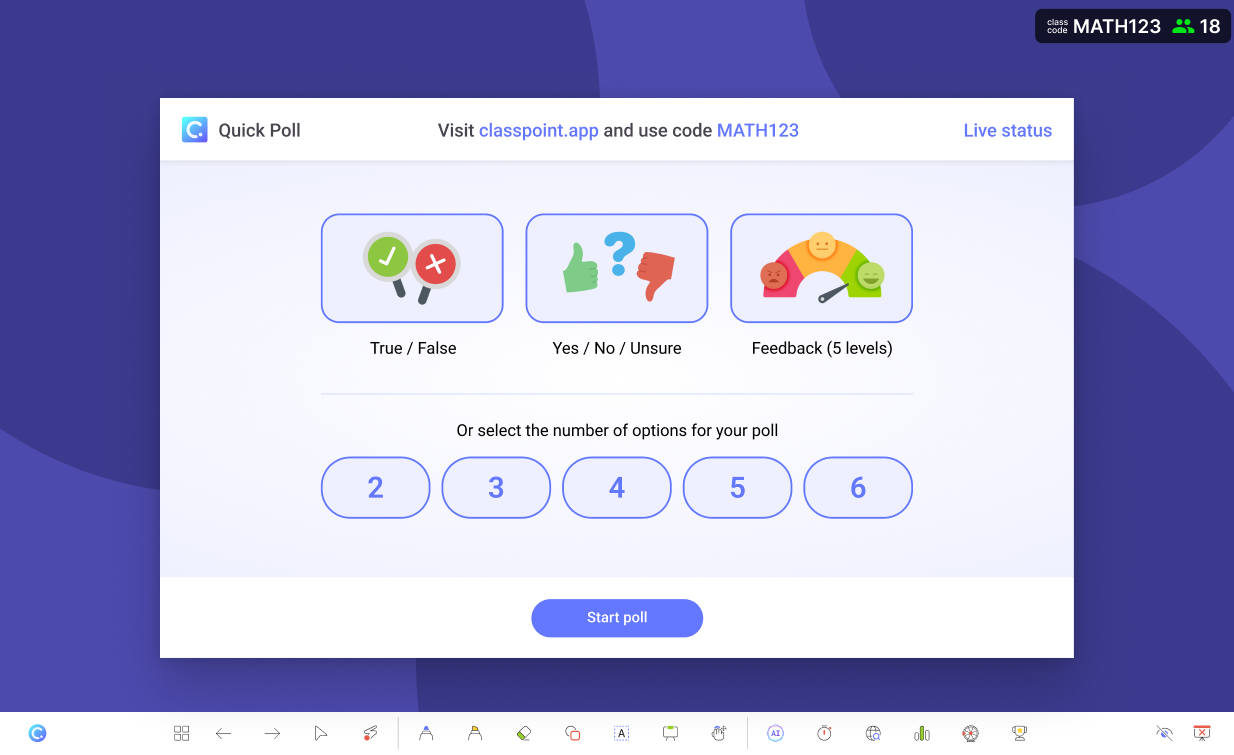
Even the sharpest checklist can misread a quiet class. Confirm (or challenge) your gut with ClassPoint’s Quick Poll:
- While in Slide Show, click Quick Poll on the ClassPoint toolbar.
- Pick a preset: True/False, Yes/No, or a feedback scale.
- Ask something simple: “Was that example clear?” or “Ready for the next part?”
- Students answer on the spot; results window fills in seconds, right over your slide.
Gather Micro-Reflections & Exit Tickets
When you’re figuring out how to measure student engagement beyond quick polls and right-or-wrong clicks, ask students to put their learning into their own words.
A one-sentence reflection, or a photo of a worked problem, captures why they think they’ve grasped something, not just whether they picked the correct option. This metacognitive layer:
- surfaces hidden misconceptions that a multiple-choice chart can’t show,
- reveals confidence levels (“I’m totally clear on… / I’m still fuzzy about…”), and
- builds a time-stamped trail of understanding you can revisit after each lesson or across an entire unit.
ClassPoint’s Short-Answer and Image Upload questions let you collect those insights quickly, right on the spot. And because these prompt styles aren’t the everyday fare students see in most platforms, participation usually hits the brim.
To further spark inspiration, here are 4 Engaging Ways to Use Image Upload in Your Lessons.
Analyze Participation Trends Over Time
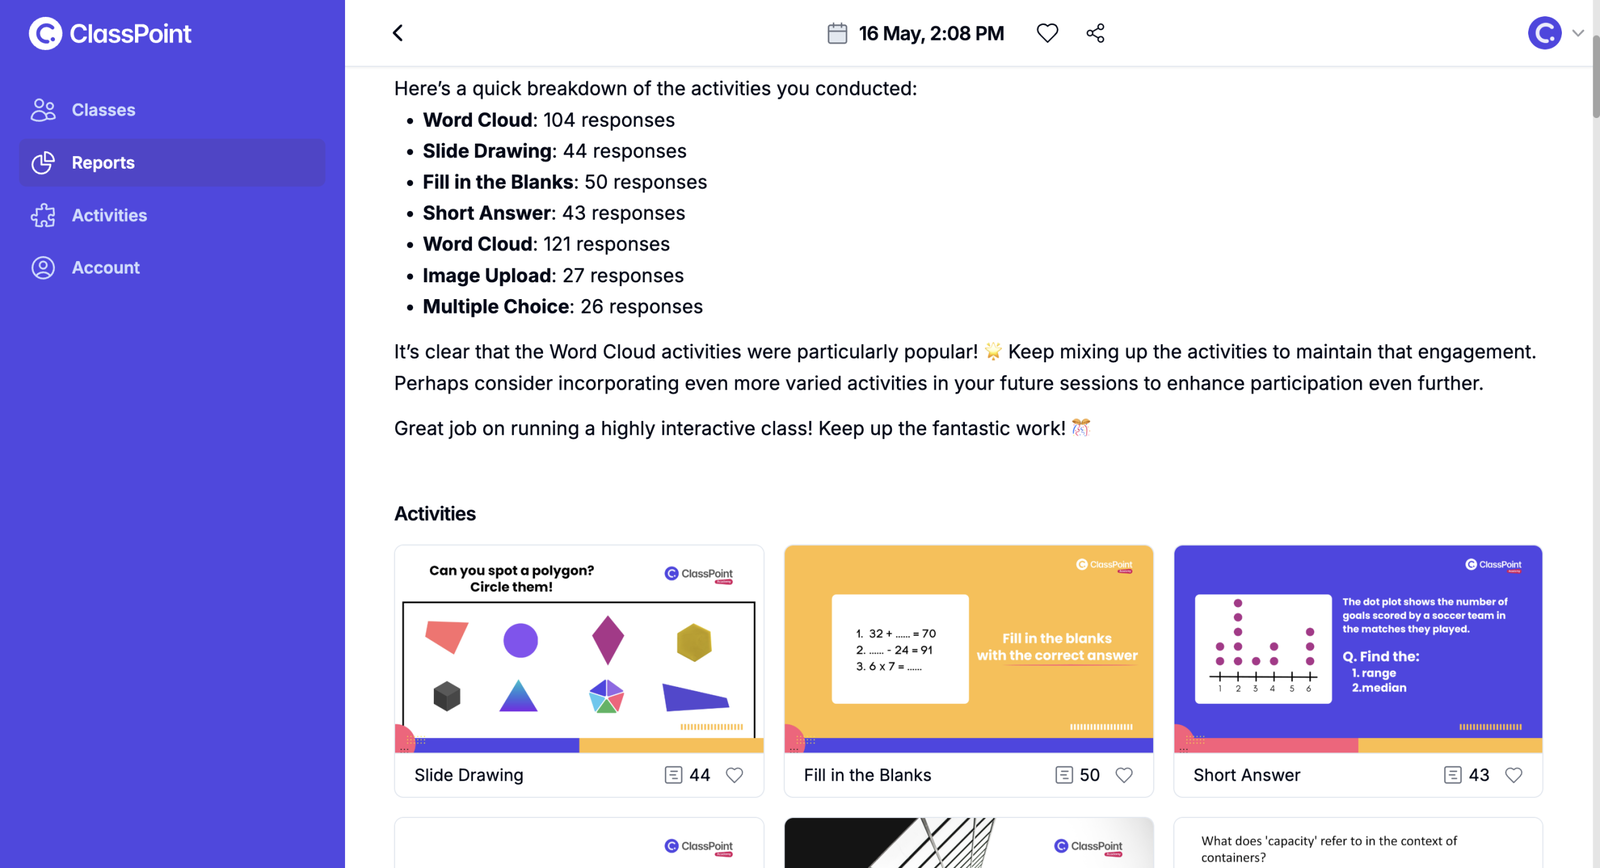
Short-term wins are great, but the real story of student engagement is how it rises (or stalls) across a unit. ClassPoint’s built-in Reports tab turns each lesson’s raw activity into an easy-to-read timeline.
Where to find the numbers:
- End the slide show as usual.
- On the PowerPoint ribbon, click ClassPoint › Reports.
- Choose the session you just ran.
| Reports View | What You See | How It Helps You Plan |
|---|---|---|
| AI Summary | A bite-size recap of participation highs, lows, and standout student moments that’s auto-generated for quick reading. | Spot patterns without crunching numbers yourself. |
| Activity Summary | Slide-by-slide response tracking, organized by order of running. | Identify concepts that consistently click, or constantly confuse. |
| Class Leaderboard | Stars, levels, and badges earned across every session, not just the latest one. | Track sustained progress, celebrate steady improvers, and notice quiet students who need a nudge. |
Put the data to work, fast.
- Scan the AI Summary for the headline: Did engagement climb, dip, or hold steady?
- Drill into the Activity Summary to see which questions drove discussion and which fell flat.
- Check the Class Leaderboard trendline to reward effort, not just top scores, fueling long-run student engagement without turning the classroom into a constant race.
Before You Go
Every question you collect, every behaviour tick you mark, and every reflection you read adds up to a clear picture of your class. Treat that picture like any other piece of lesson content: review it, learn from it, and apply it right away.
- Review today’s numbers while the lesson is fresh.
- Adjust one slide, prompt, or example for the next class based on what the numbers show.
- Share a single insight with students so they see their feedback shaping what comes next.
Build this mini-cycle into your daily routine and measurement becomes part of the teaching process, not an extra task. With ClassPoint sitting inside the slides you already use, each step stays quick and familiar. Start with one interactive slide tomorrow, follow the cycle, and watch student engagement climb.
FAQs
How often should I revisit the data when figuring out how to measure student engagement effectively?
Look at the numbers in three windows: immediately after class (to fix tomorrow’s slide), mid-unit (to see trendlines), and at the unit’s end (to inform grading or conferences). This cadence balances quick tweaks with long-range insight.
What’s a smart next step if my classroom engagement dips halfway through a lesson, even with live polls in place?
Shift modalities, not just pace. Swap an information-heavy slide for a one-minute peer-explanation prompt, then run a Quick Poll to see if the dip recovers. The change keeps content moving while resetting attention.
I teach shy students who avoid live quizzes. How can I still capture meaningful student engagement data?
Use Short Answer reflections set to “anonymous” and Image Upload tasks that let them submit work without speaking up. These quieter channels give introverted learners equal weight in the data you collect.
Does measuring engagement differ in hybrid or remote settings?
Yes. In-person, body-language sampling is a key metric. Online, swap that grid for digital cues, such as chat participation, emoji reactions, and on-time submission stamps. Combine these with your regular polls to keep the dataset consistent across environments.
What’s a common mistake teachers make when they first learn how to measure student engagement, and how do I avoid it?
The biggest pitfall is chasing every metric at once. Start with a single goal, (say, raising response rates on comprehension checks) then add other indicators after you’ve nailed that one. Focus breeds clarity; overwhelm breeds inaction.
